")
")

Development of a Tracer Test in a flooded Uranium Mine using Lycopodium clavatum
Diese E-Mail-Adresse ist vor Spambots geschützt! Zur Anzeige muss JavaScript eingeschaltet sein!, I. Trebušak, N. Feldtner
Development of a Tracer Test in a flooded Uranium Mine using Lycopodium clavatum
Hydrogeochemical investigations of a flooded uranium mine in the Erzgebirge/Germany
Article published in Tracer Hydrology 97 (Balkema 1997)
Abstract
The polymetallic Niederschlema/Alberoda uranium deposit in the Saxonian Erzgebirge (Ore Mountains) has been flooded since 1991. The objectives of the tests were to investigate the quality and rate of flow within a large part of the flooded mine to predict the mass flow of the pollutants. Based on the results of a first tracer test with Lycopodium clavatum in mid 1992 a second one was conducted at the end of 1995.
Four insertion and two sampling points were chosen and at each sampling point up to 800 g of coloured spores were inserted by using a newly developed insertion apparatus: LydiA (Lycopodium Apparatus). Beginning one day after insertion, at each sampling point two samples per weekday were taken. Out of the 15 samples an aliquot amount of material was counted and resulted in a reasonable good recovery rate of 2 %.
It could be shown, that the mean speed of the mine water within the investigated part of the mine ranges between 3 and 8 m min-1 and that the different parts of the mine are hydraulically well connected with each other. Therefore it may be that the pollutants within the flooded mine are transported by convective flow resulting in an exchange from deeper parts of the mine into higher ones.
1 INTRODUCTION
1.1 The Niederschlema/Alberoda Mine
In January 1991 the controlled flooding of the mine, which will be completed as early as 2003, began. During the mine water's circulation through the open mine works it will be enriched in various elements, some of them being toxic to both humans and the environment. Therefore the up to date remediation plans for the Niederschlema/Alberoda mine include treatment of the discharged water as soon as the water table will reach the water-adit Markus-Semmler (Gatzweiler & Mager 1993).
At the beginning of the flooding only little was known about the hydrogeochemical, thermal, and hydrodynamic processes during the flooding. Hitherto numerous consultant works and a Ph.D. thesis have been undertaken on these subjects, but the hydrodynamic conditions during the flooding and within the water body have only been outlined in general (Wolkersdorfer 1996, Merkel & Helling 1995).
Already in 1991 a tracer test was considered and the Wismut GmbH entrusted one of the authors (C.W.) with establishing a program for a tracer test, which will be suitable for the special conditions in the mine water. Based on the results of a first tracer test in the mid of 1992 (Wolkersdorfer 1993, 1996) a second one was conducted at the end of 1995. Some results of these tests, especially of the latter one, will be described here.
At the beginning of the tracer test on November 16th 1995 the mine was flooded as far as the level -726 (approx. -390 mNN). Due to a rapid raise of the water table to level -720 (approx. -386 mNN) the test had to be stopped on November 27th 1995, one week earlier than scheduled.
In the deepest parts of the mine rock temperatures of 70 °C have been measured. It is not known if the water there currently has the same temperature, but in January 1991 a water temperature of 52 °C was observed at level -1800 (G. Fröhlich, pers. comm.) and between June 1992 and December 1994 a maximal water temperature of 41 °C with an average of 36 °C was measured (Wolkersdorfer 1996). The total volume of the mine water within the flooded part of the mine had reached 13.9 · 106 m³ at the time of the 1995 tracer test.
1.2 Objectives of the Tracer Test
There are four questions which should be solved by the tracer test in the Niederschlema/Alberoda uranium mine:
- How high is the mine water's speed in the flooded mine works?
- Which paths through the mine works are used by the water?
- Are the dams (bulkheads) at the onsetting stations still effective?
- Is the similar chemical composition of the mine water in different shafts caused by mixing of the water?
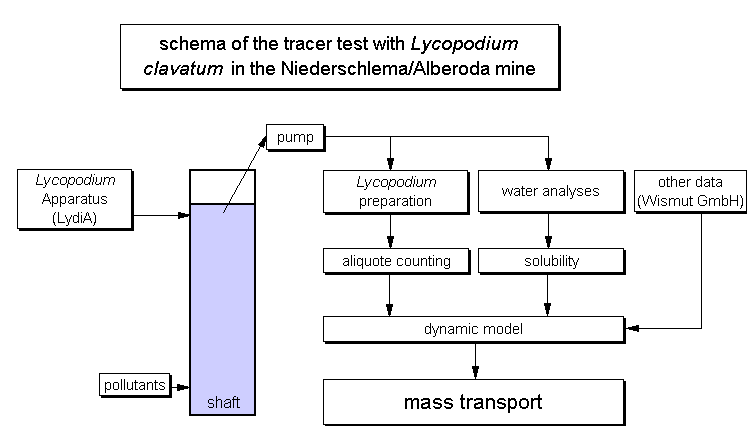
Fig. 1: Schema of the tracer test with Lycopodium clavatum and the questions connected to the test.
1.3 Using Lycopodium clavatum as a Tracer
First hints for the possible use of Lycopodium clavatum as tracer are given by Timeus in 1910 (cited in Käß 1992) but not until 1953 the method and its positive application was described in the literature (Mayr 1953). Initially only natural spores served as tracers, but since Zötl's (cited after Käß 1992) and Dechant's (1960) work also coloured spores could be used. The latest improvement was the introduction of fluorescent spores by Käß (1982), speeding up the time consuming counting.
To our knowledge, no tracer test with drifting material has ever been conducted in a flooded mine. Over and above no method is known to release drifting materials into a water body in a certain depth. Extensive studying of the literature yielded no similar tracer test at all. Tracer studies in the Stripa mine (Sweden) or Konrad mine (Germany) investigated the fracture network between the galleries by the use of radioactive tracers and dyes (Birgersson et al. 1992, Kull 1987). Horn et al.(1995) used natural U-Th-ratios as tracers in a flooding experiment at the Königstein mine (Germany).
2 METHODS
2.1 Preparation of Lycopodium and LydiA
This restriction caused the conclusion to use non fluorescent spores for the tracer test in the Niederschlema/Alberoda uranium mine. Based on the results of Dechant (1960), Eissele (1961), and Drews & Smith (1969) six dyes were chosen for dying the spores according to a slightly modified method introduced by Dechant (1960): bismarck brown, fuchsin, safranine (saffron), nile blue, malachite green, and crystal violet, the first two for the 1992, the others for the 1995 test.
One of the main problems while conducting a tracer test with Lycopodium clavatum is to avoid contamination, not only in the laboratory, but at the insertion points. Dechant & Hacker (1986) describe one possible method for contamination free insertion. For the tracer test in the Niederschlema/Alberoda mine another problem had to be solved:
Release of spores has to be accomplished in a specified depth at a certain time without contamination of the water body above the final injection position.
During the 1992 test the abandoned piping system for the water drainage could be used for insertion. By opening and closing different slide valves at pumping station 296 II (level -996) the spores were inserted at two depths at distinct localities. To prevent contamination between the two insertions the piping system had to be flushed for 19 hours with 2000 m³ of infiltration water. Although this method solved the above mentioned problem, it is unreasonable for a tracer test in a larger scale. Therefore LydiA (Lycopodium Apparatus), a sonde for inserting spores at certain depths, was constructed and will be applied for a patent. A chemical lock and holders to be used with a cable winch assured the solution of the above mentioned problem.
As could be shown, the lock dissolves within 6 to 10 hours after insertion into the warm mine water (Wolkersdorfer 1996). In the laboratory the most part of the spores injected within the first 30 minutes and without jerky movements of LydiA it takes up to 24 hours to complete injection. For this reason, to be on the safe side and to guarantee injection of all the spores into the mine water, all LydiAs were moved jerkily after 25.26 hours of insertion.
2.2 Spore budget
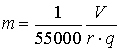
In view of the fact that 90.99 % of the spores might be lost (Maurin & Zötl 1960, Wolkersdorfer 1996) and that at least four spores per pumping hour should be detectable, the undermentioned formula was deduced. It is based on the hypothesis that the water in the mine is well mixed by convective flow and the spores are even distributed in the water.
-
m: total mass of spores, g
-
V: volume of enclosed fluid, m³
-
r: recovery rate of spores, %
-
q: pumping capacity, L min-1
Assumed that 13.9 · 106 m³ of water would be in the mine, the recovery rate to be 1 %, and the pumping capacity be between 0.3 and 0.4 L min-1, the amount of spores needed for the tracer test was calculated to range at least between 630 g and 840 g per colour. As has been shown by the 1992 tracer test, where the recovery rate was assumed to be 0.5 %, this is enough to obtain reasonable results.
For the tracer test at the Niederschlema/Alberoda mine, four LydiAs were loosely filled with the coloured spores and carefully assembled in the laboratory to prevent contamination. Tab. 1 lists the used masses of spores and some of the test's details.
Tab. 1: Mass of spores, used dyes and depths of insertion and sampling points (shafts) in mNN.
| Insertion/sampling
|
mass of spores
|
colour of dye | depth
|
| 371 (insertion) | 804,2 | nile blue A | -652 |
| 296 II b (insertion) | 805,3 | safranine T | -639 |
| 366 b (insertion) | 722,6 | malachite green | -639 |
| 383 (insertion) | 764,0 | crystal violet | -397 |
| 296 II b (sampling) | - | - | -423 |
| 366 b (sampling) | - | - | -419 |
2.3 Insertion and Sampling
Insertion, sampling and preparation of samples were done on different places and levels to minimise sampling errors. While the sonds were lowered from level -550, where also the sample preparation took place, sampling was conducted at level -720.
In the mine each LydiA was fixed to a mount and slowly lowered to the appropriate depth using cable winches which were hold at the final depth during the whole duration of the tracer test. This was to prevent contamination of the water body while pulling out the opened LydiAs.
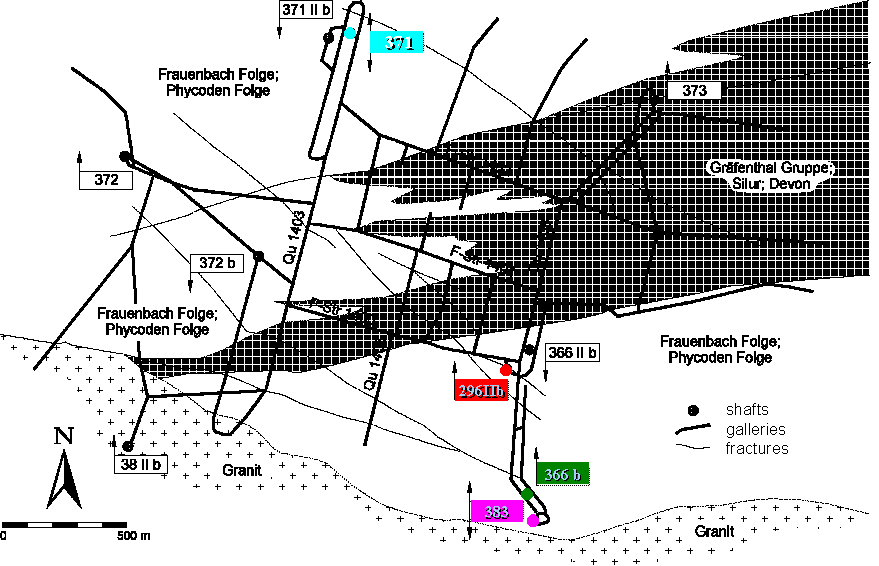
In shafts 371, 296 II b and 366 b the LydiAs were lowered up to 260 m below the mine water's surface, close to the onsetting stations at the main level -990 (see Fig. 2 for details). Unfortunately, the glueing of LydiA failed in shaft 383 after 20 meters of lowering and nearly half of the crystal violet coloured spores were spread over into the return air. Contrary to the original planning this LydiA was then lowered only 10 m below the mine water's surface, according to 20 m below the onsetting station of level -720.
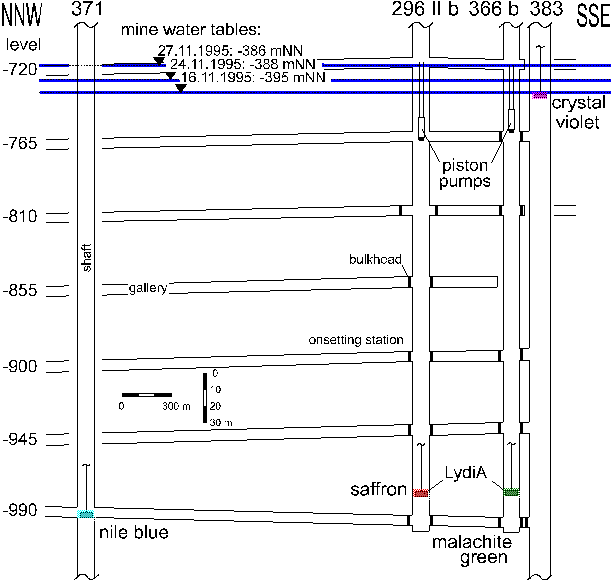
Fig. 2: Geometric details of the 1995 tracer test in the Niederschlema/Alberoda mine.
Because of the mine's operational sequence, insertion of LydiA in shafts 366 b and 383 had to be carried out before, in shafts 296 II b and 371 after starting of sampling. As the opening time of the LydiAs was to be scheduled 6.10 hours after insertion this was not to be seen as a disadvantage for the test.
Two mini piston pumps (Pleuger Mini-Unterwasserpumpe, Pleuger Worthington GmbH/Hamburg), one in shaft 296 II b, 28 m below the water level, the other one in shaft 366 b, 25 m below the water level, were installed. All of the discharged water was then fed into a filter system on level -720 to recover the spores. The use of mini pumps with pumping capacities well under the net water inflow, which was assumed to be 3000 L min-1, avoids the establishment of a significant flow field to the pumps. Their capacity depends on both, the delivery head and the water level. In shaft 366 b the pumping capacity ranged from 0.39.0.41 L min-1 and in shaft 296 II b from 0.31.0.55 L min-1.
For the 1992 tracer test a vertically installed plankton net was used (Maurin & Zötl 1960, Atkinson 1968, Gardener & Gray 1976, Käß 1992). Unfortunately the wooden frame was quickly destroyed by either bacteria or mould and the pores of the nylon nets were blocked by too much sediment, bacteria and mould. Therefore a new filter system with coarse as well as fine nylon nets had to be established to stand the warm and humid environment within the mine. Both, a cheap price and easy use, even for unskilled persons, had to be guaranteed.
Based on these experiences a filter system was constructed, which consists of three plastic parts, normally being used in sewage disposal (Marley GmbH/Wunstorf; DN 150: DIN 19534), and two nylon nets fixed between the plastic parts. The upper net has a mesh size of 335 µm (NY 335 HC, Hydro-Bios/Kiel), the lower lycopodium net one of 30 µm (NY 30 HC), both nets being 270 × 270 mm in size.
Although Käß (1992) recommends a 25 µm mesh size for the nets, a 30 µm net was installed under the special circumstances with the mine water having 61 mg L-1 filter residue in average (Wolkersdorfer 1995). According to the investigations of Batsche et al. (1967) this mesh size should yield at least 80 % of the total spore number. In the case of the tracer test described here, it will be definitely more, as the net's pores will soon be partly blocked by sediment.
At the time of sampling the whole filter system on level -720 was changed for a new system with cleaned plastic parts and unused nets. The used system was dismounted on level -550, the 335 µm net and the plastic parts carefully rinsed, and the rinsing water as well as the 30 µm net collected in a plastic bag for later evaluation. Details of the sampling results are listed in Tab. 2 and are discussed in chapter 2.5.
Tab. 2: Results of the aliquot counting of the 1995 tracer test with Lycopodium clavatum in the Niederschlema/Alberoda mine. time: pumping time in hours and minutes, distance between sampling and insertion points in m.
| Sampling point | sample | safranine T | malachite green | nile blue A | crystal violet | pumping time |
| 296 II b | 366 b | 371 | 383 | [hours] | ||
| 296 II b | 296-17 | 1 | 26 | 24 | 72 | 72:54 |
| 96-20 | 174 | 160 | 188 | 824 | 22:50 | |
| 96-21a | 96 | 244 | 82 | 564 | 3:32 | |
| 96-21b | 60 | 80 | 40 | 106 | 42:58 | |
| 96-23a | 354 | 598 | 358 | 1112 | 4:30 | |
| 96-23b | 322 | 254 | 522 | 752 | 19:16 | |
| 96-24a | 172 | 452 | 180 | 784 | 4:20 | |
| 96-24b | 38 | 12 | 16 | 38 | 67:45 | |
| sum | 1217 | 1826 | 1410 | 4252 | ||
| distance, m | 216 | 776 | 2159 | 736 | ||
| 366 b | 6-17 | 30 | 30 | 132 | 192 | 91:59 |
| 66-20 | 260 | 670 | 352 | 852 | 23:47 | |
| 66-21a | 70 | 100 | 164 | 518 | 3:59 | |
| 66-21b | 28 | 58 | 34 | 82 | 44:54 | |
| 66-23a | 254 | 526 | 206 | 1008 | 2:52 | |
| 66-23b | 266 | 454 | 230 | 602 | 20:44 | |
| 66-24a | 242 | 292 | 94 | 202 | 4:12 | |
| sum | 1150 | 2130 | 1212 | 3456 | ||
| distance, m | 780 | 220 | 2723 | 172 | ||
| total | 2367 | 3956 | 2622 | 7708 | - |
2.4 Sample Preparation and Counting
After one day of reaction the samples were filtered through 8 µm cellulose nitrate filters (Sartorius/Göttingen) with 50 mm diameter, using Nalgene plastic filters for membrane filtering with a vacuum pump. This is an adapted method introduced by Käß (1982) for the counting of fluorescent spores. After each filtration the Nalgene filters, the filter unit, and the working tables in the laboratory were cleaned to exclude any kind of contamination during sample preparation.
Every filter with the filter residue was then stored in a Petri dish bottom, covered with a Petri dish top and air dried in the laboratory. Further details for sample preparation can be found in Eissele (1961) or Käß & Reichert (1986). After drying, all filters were mounted between two glass plates, 56 × 63 mm in dimension. Prior to mounting each glass plate was cleaned with ethyl alcohol and acetone in a separate room. Finally the glass plates were fixed with tape and labelled with the sample number.
For the investigations a Leitz Ortholux 2 Pol-BK microscope with wide angle oculars (10×) and two different objectives (25×, 40×) was used, resulting in a magnification of 250 and 400 respectively.
Nearly all the samples contained high amounts of sediment. Nevertheless the samples could be used because the spores normally are on the top of the sediment as has been stated by Eissele (1961). Unfortunately, after drying some of the membrane filters were covered with a thin film of small, transparent crystals as a result of the adding of edetic acid. In spite of this film it was possible to identify the spores because the crystal's thickness is always less than the spore's diameter.
Due to this high amount of suspended material the printed net on the membrane filters, which should have been used for aliquot counting, could not be seen. By dividing every sample into four quarts, another aliquot method to reduce the necessary time for counting was used. Interestingly, the dyes nile blue and malachite green, which were easily distinguishable prior to the tracer test, were hard to distinguish after having been in the mine water. Therefore the use of two persons for counting had two reasons: to improve the statistical significance of the aliquot counting and to avoid wrong interpretations as a result of distinct colour sights. It could be shown that the differences in the numbers of spores per colour and the total numbers of spores per quart are not high enough to prove a significant statistical difference between colours and quarts.
2.5 Results and Discussion
Tab. 2 lists the results of the counting as well as the pumping times and the names of the coloured spores inserted in each of the four shafts. The pump was running for 238 hours at sampling point 296 II b and 192 hours at point 366 b, having pumped 4460 L and 4470 L of mine water, respectively. On the basis of the aliquot counting, the total number of spores found are 2367 for safranine T, 3956 for malachite green, 2622 for nile blue A and 7708 for crystal violet. The total loss was 98 %.
All the spores in samples 296-17 and 6-17 arise from contamination either during sample preparation in the laboratory or, more probable, during filter installation in the mine. Since it was not possible to have two teams in the mine, one for installation of filter systems and LydiA, the other one for changing the filter systems, contamination could not fully be omitted on the first day of the tracer test. Therefore it must be considered that approximately 30 spores of each sample are due to contamination. The high number of crystal violet spores in both blind samples is a result of the destroyed LydiA in shaft 383. Return air from shaft 383 moves on level -540 to shaft 366 b and from there to shaft 296 II b, finally reaching the day shaft 371. In view of the fact that the filter system for sample 6-17 was filled with mud at the time of sample collection, it was not possible to have it sealed before insertion of the crystal violet spores, resulting in the relatively high number of violet spores in this sample. However, sample 296-17 was taken after the incident in shaft 383. Therefore, the spores transported through the air respond for the 72 crystal violet spores in the sample. Nothing can be said about the reason for the 132 nile blue spores in sample 6-17. It must be considered that they are the result of contamination.
Already in the first samples (96-20 and 66-20), spores from each insertion place are existing (Tab. 2, Fig. 3). Because the numbers are significantly higher than in both blind samples no contamination will be taken into account. This result is interesting in so far as the shortest distances between the sampling and insertion points are within an interval of 200 m and 2700 m (Tab. 2). Therefore it could not be expected to find nile blue spores already in samples 96-20 and 66-20.
Based on the shortest flow distances, mean opening time for LydiA, as well as 16 %, 50 % and 84 % quartiles of travelling time, the maximal mean speed of the spores can be calculated to be 8 m min-1 (Fig. 4). The mean speed for all spores in the first set of samples is approximately 3 m min-1, fitting well with the results of flow meter measurements in shaft 371 II b (Wolkersdorfer 1996).
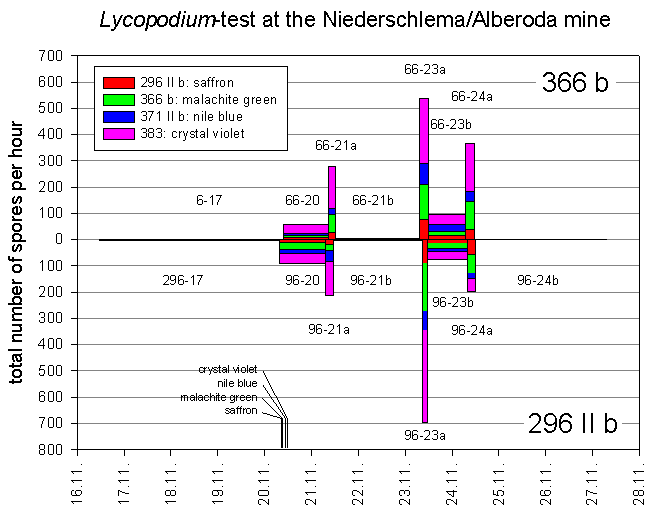
Fig. 3: Results of the tracer test in the Niederschlema/Alberoda mine given in spores per hour for the hole duration of the test. The width of each box represents the pumping time as shown in Tab. 1. Also shown, between the 20th and the 21st, are the insertion times of the four LydiAs.
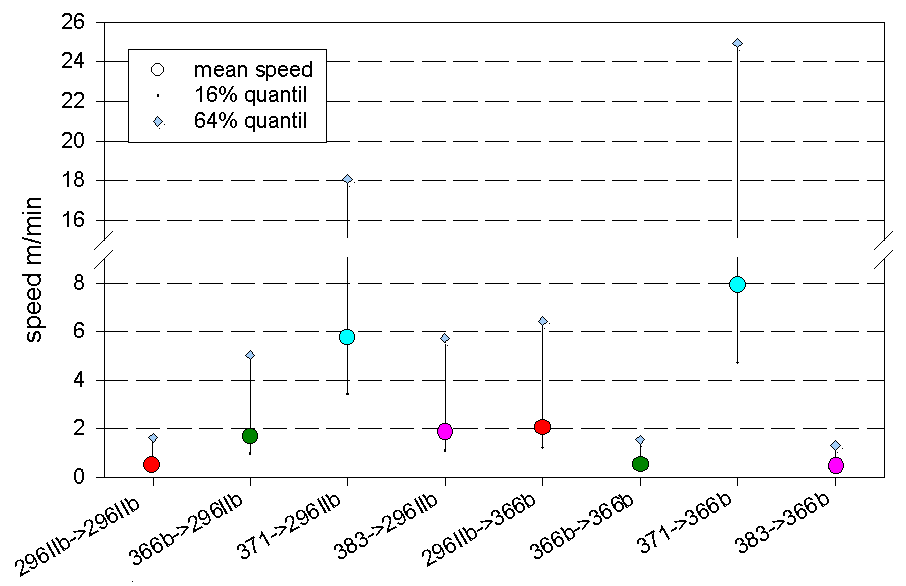
Fig. 4: Mean speed of the flooding water in the Niederschlema/Alberoda mine calculated for each injection and sampling location.
As can be seen in Fig. 3 the number of spores arriving at the sampling points is not evenly distributed over the length of the experiment. A first maximum is found 17 hours, a second one 65 hours after opening of the chemical lock. Between these two maximums only a minimum of 10.12 spores per hour was found. The second maximum is again followed by a period of less spores arriving at the sampling points and finally there is a third maximum after 89 hours. In the case of sampling point 296 II b it is followed by a period of 68 hours with less than 1 spore per hour arriving. The sampling at 366 b had to be stopped due to the fast rising water table.
This is an interesting result, as the number of spores per hour was expected to raise to a certain level and staying constant by the end of the test. Not until 5 to 6 weeks after injection, the numbers were expected to fall to 10 spores per hour, as has been revealed by the first tracer test in 1992 (Wolkersdorfer 1996). Contrary to the 1995 test, sampling of the spores in the 1992 test started 42 days after insertion, due to high Radon concentrations at the expected sampling point. Therefore no data was available to estimate the distribution of spores within time and space of the mine or to compare both tests.
Four explanations for the uneven temporal distribution are possible:
- sampling errors
- breakdown of power supply
- convection in the shafts, and
- varying flow paths.
Comparing the total numbers of safranine and malachite green spores at sampling points 296 II b (ratio 1:1.5) and 366 b (ratio 1:1.9) it is evident that safranine spores in both cases are fewer than the malachite green ones. Expecting the flow regime in both shafts to be similar, the number of safranine spores at sampling point 296 II b should have been higher than observed. Moreover, the result is interesting as the mass of inserted spores (1.1:1) is indirect proportional to the number of observed ones. Obviously the upward movement of the water in shaft 366 b is more developed than in shaft 296 II b.
3 CONCLUSIONS
The tracer test with Lycopodium clavatum in the mine water of the Niederschlema/Alberoda mine has produced useful results. Insertion of the drifting material by the use of specially constructed sonds (LydiA) with a chemical lock and inserting them at a certain depth proved to be possible.
It could be shown that the mine water's speed averages 1 m min-1 in the vertical shafts and 6 m min-1 in the horizontal galleries. The mean speed of the water was about 3 m min-1. Within less than 24 hours spores from all four insertion localities reached the two sampling points, thus showing a good hydrodynamic connection of all the investigated shafts and galleries. The similar chemical composition of the mine water in different, even far apart shafts must therefore be considered as a result of the water's convective flow. Furthermore, the tracer test implicates, that the chemical similarities of water analyses in different depths of a single shaft are also due to a good mixing of the water.
The dams (brick walls) on the onsetting stations seem to have no noticeable influence on the large scale mixing of the water, although the results of the tracer test gives no clarity about small scale movements in the vicinity of two dams. Nevertheless, it seems that the dams do not reduce the mixing significantly at all. Unfortunately the tracer test gave no satisfying answer to the question of the exact water paths. The first sampling interval is too long compared to the water's speed, therefore only general estimates of paths might be done. It is obvious that the former main level -990, and after having been flooded, also level -720 act as good horizontal paths for the water. They seem to distribute the water everywhere over the investigated part of the mine. Consequently it must be considered that also water from deeper parts of the mine, and pollutants, will reach the upper parts within a relatively short time, most certainly in less than a day. It is important for further tracer tests to have a sampling interval of 6.12 hours, especially for the first samples.
Important transport paths for water and pollutants in the mine are therefore the main levels and the shafts connecting them. Even places far apart from each other and off the main galleries are bind up into the water stream fair well. Based on the results of the tracer test it must be expected that water which is in contact with highly mineralised parts of the mine is included in the general convection cell.
As the motor for the fast convection the high temperatures (up to 70 °C) in the deeper parts of the mine must be supposed. In all probability, highly contaminated water will therefore always be within the portion of the mine taking part in the convective mixing. This is usually the whole water body under the last level to be flooded. Consequently, a proposed treatment plant would have to treat contaminated water for a relatively long time period.
As the dams on the onsetting station do not have the desired effect of stopping the interchange of water, another method must be considered instead. Plugging the vertical connections at a very high level in the mine would stop the transport of contaminants from deeper parts into higher parts. It can therefore be assumed that vertical sealing of the mine makes a treatment plant superfluously.
4 ACKNOWLEDGEMENTS
The authors would like to thank the Wismut GmbH/Chemnitz, especially J. Meyer, J. Schreyer, G. Lein and G. Fröhlich for the helpful support during the whole tracer test. Thanks to R. Schecke for his counting of spores. One of us (I.T.) received a grant from the Slovenian Ministry of Education and the German Academic Exchange Service/Bonn, the other one (C.W.) from the Hanns-Seidel-Foundation/Munich. Support has also been given by the German Science Foundation/Bonn under contract Re 920/1-2 (Univ.-Prof. G. Reik, PhD).
5 REFERENCES
Zum Erkunden
Schauen Sie sich das an
Kontakt


© Christian Wolkersdorfer – außer anders ausgewiesen
Webdesign + SEO solutions
„rem tene,verba sequentur”